> For the complete documentation index, see [llms.txt](https://bellingcat.gitbook.io/toolkit/llms.txt). Markdown versions of documentation pages are available by appending `.md` to page URLs; this page is available as [Markdown](https://bellingcat.gitbook.io/toolkit/more/all-tools/radar-interference-tracker.md).

# Radar Interference Tracker

## URL

[https://ollielballinger.users.earthengine.app/view/bellingcat-radar-interference-tracker](https://ollielballinger.users.earthengine.app/view/bellingcat-radar-interference-tracker#lon=49.9507;lat=26.6056;zoom=4;)

## Description

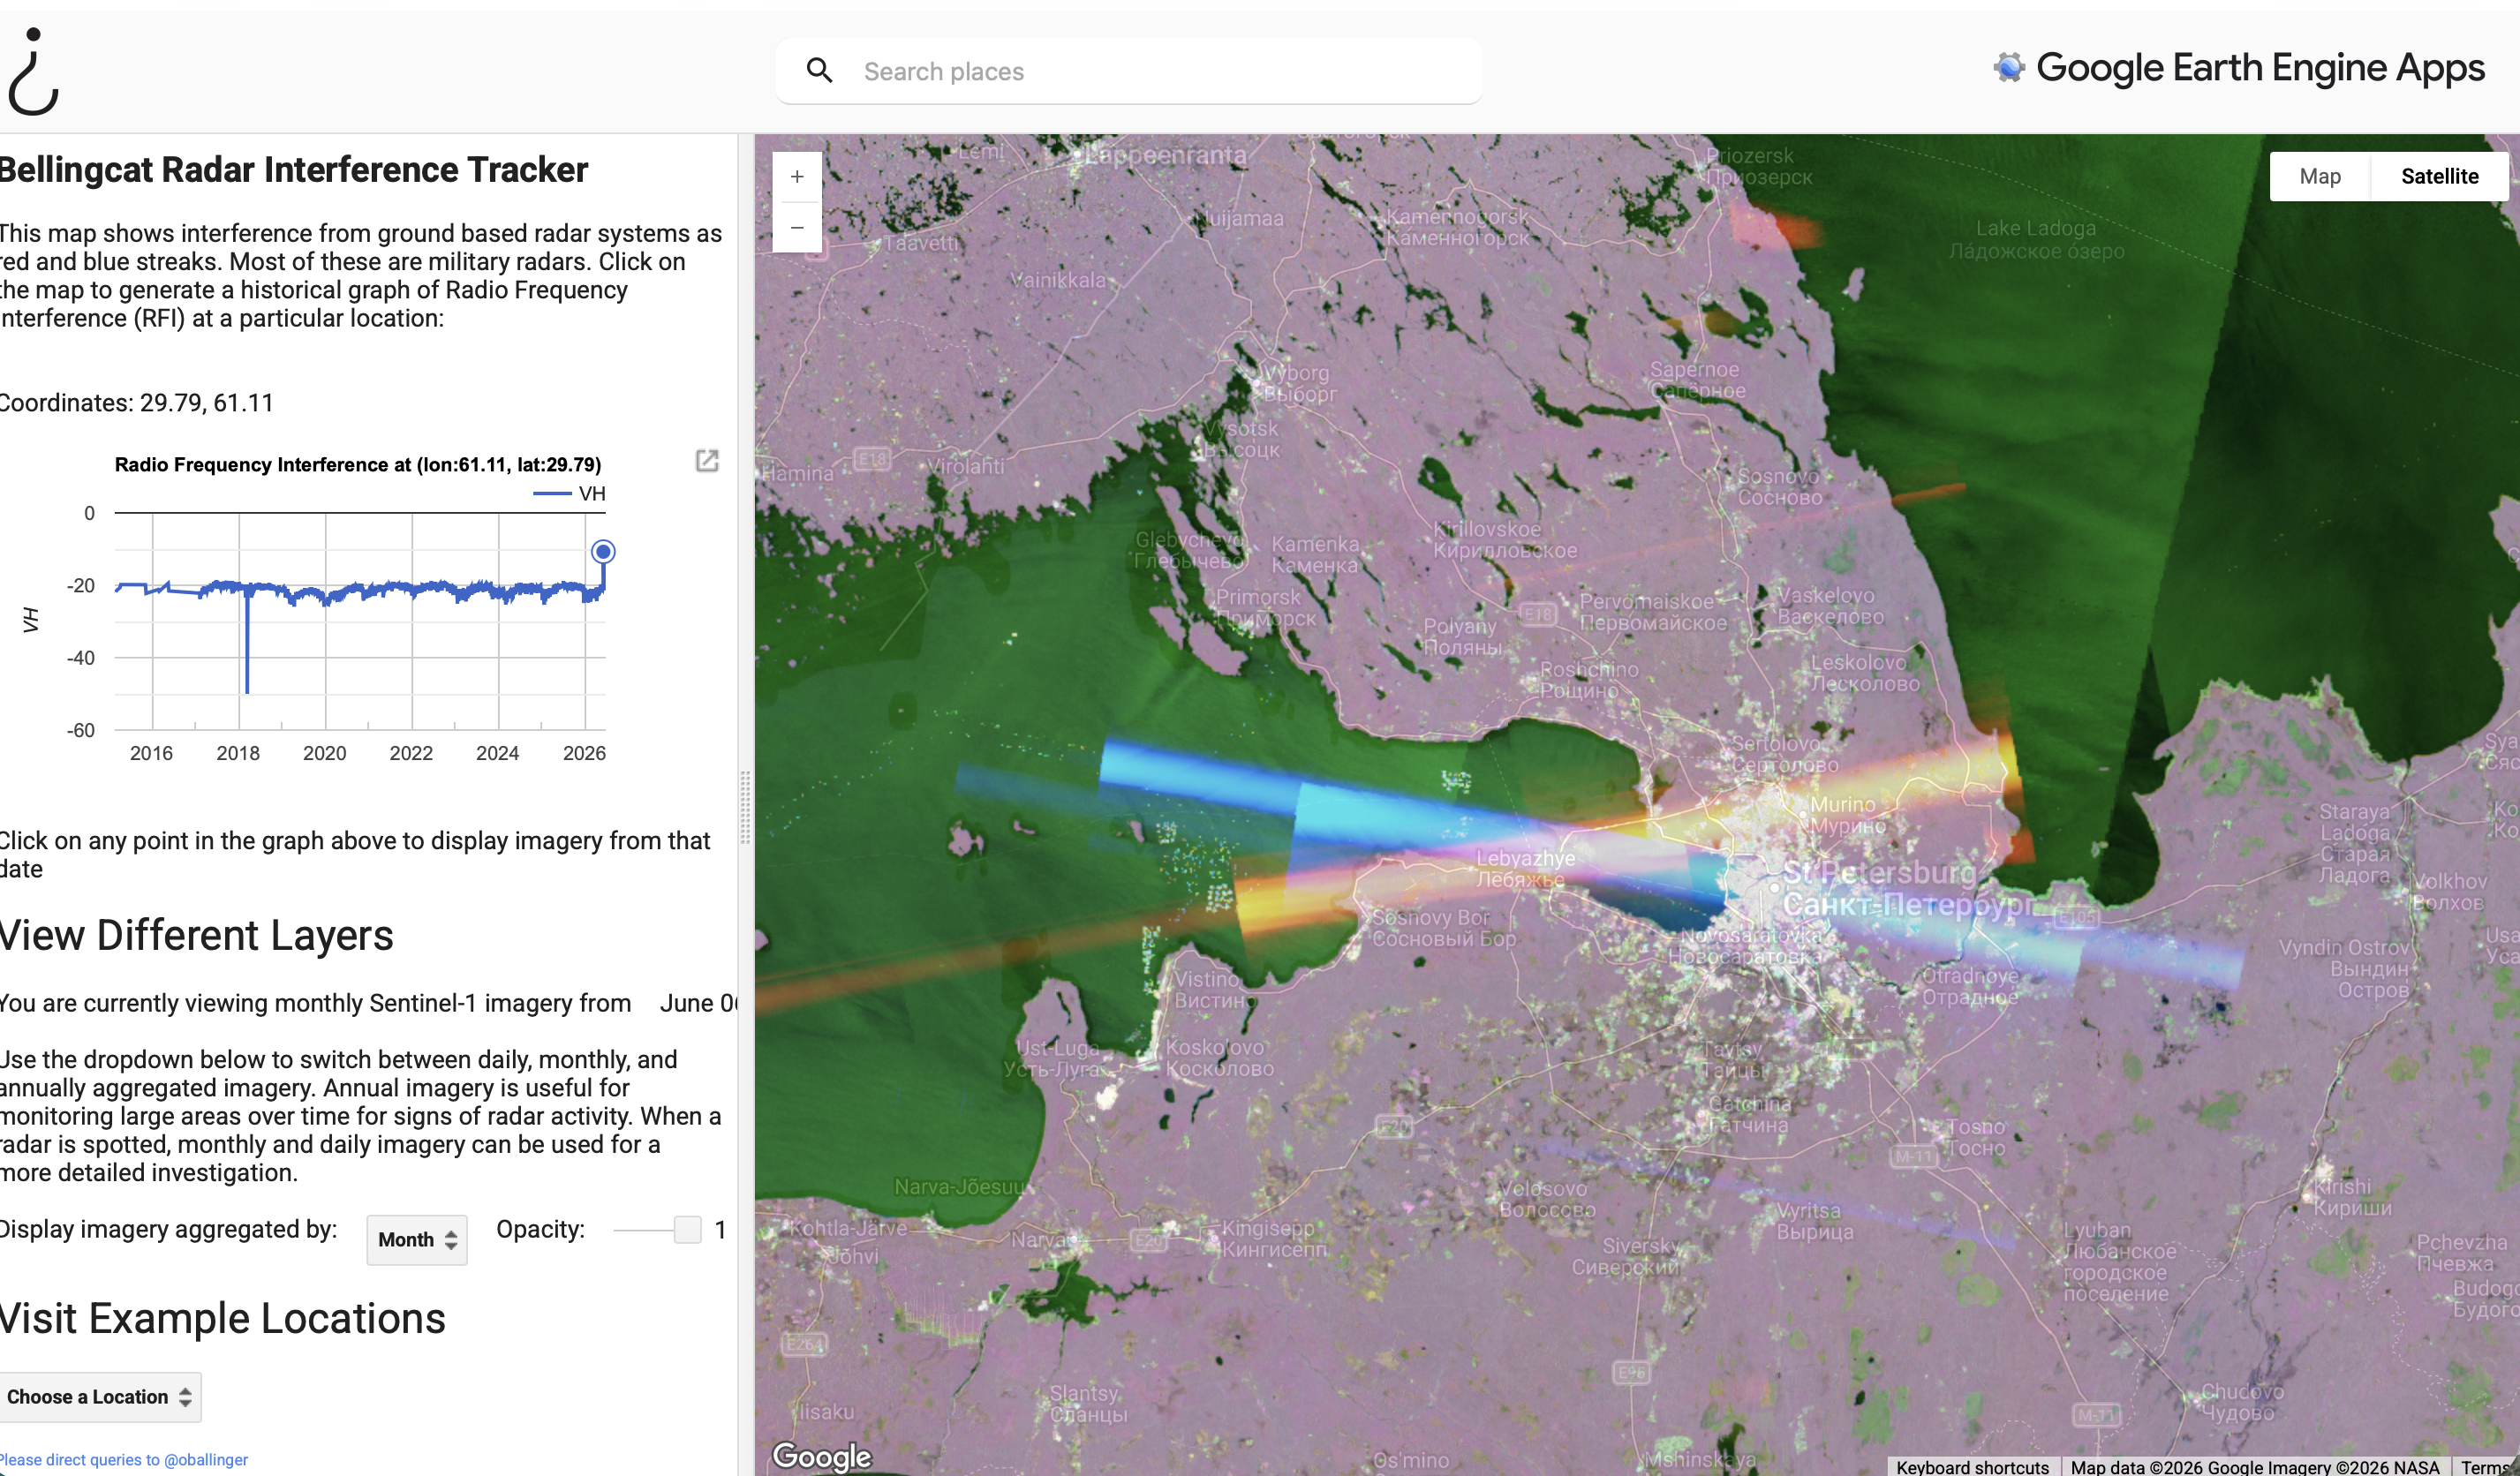
The Bellingcat Radar Interference Tracker (RIT) is a web-based tool that visualises radar interference on Google Earth, where the user can choose between satellite or terrain "road" maps, which can then be used to search for and potentially locate active military radar systems around the globe.

The tracker shows the output of [Copernicus Sentinel 1](https://www.esa.int/Applications/Observing_the_Earth/Copernicus/Sentinel-1) mission, which provides global imagery using the [Synthetic Aperture Radar (SAR)](https://www.earthdata.nasa.gov/learn/earth-observation-data-basics/sar) from two satellites (Sentinel 1A and Sentinel 1C) constantly circling the globe. The Sentinel 1 imagery built from the SAR sensors is available regardless of cloud cover or time of day because it uses radio waves. In this tool, the Sentinel 1 images are overlaid with Google Earth imagery to enable both radar and visual analysis across the globe.

The tracker exploits a known flaw in Sentinel-1 SAR imagery. Military radar systems, such as Patriot missile batteries, emit a radar pulse when turned on that interferes with Sentinel's SAR signal, creating a stripe of interference perpendicular to the orbital path of the satellite.

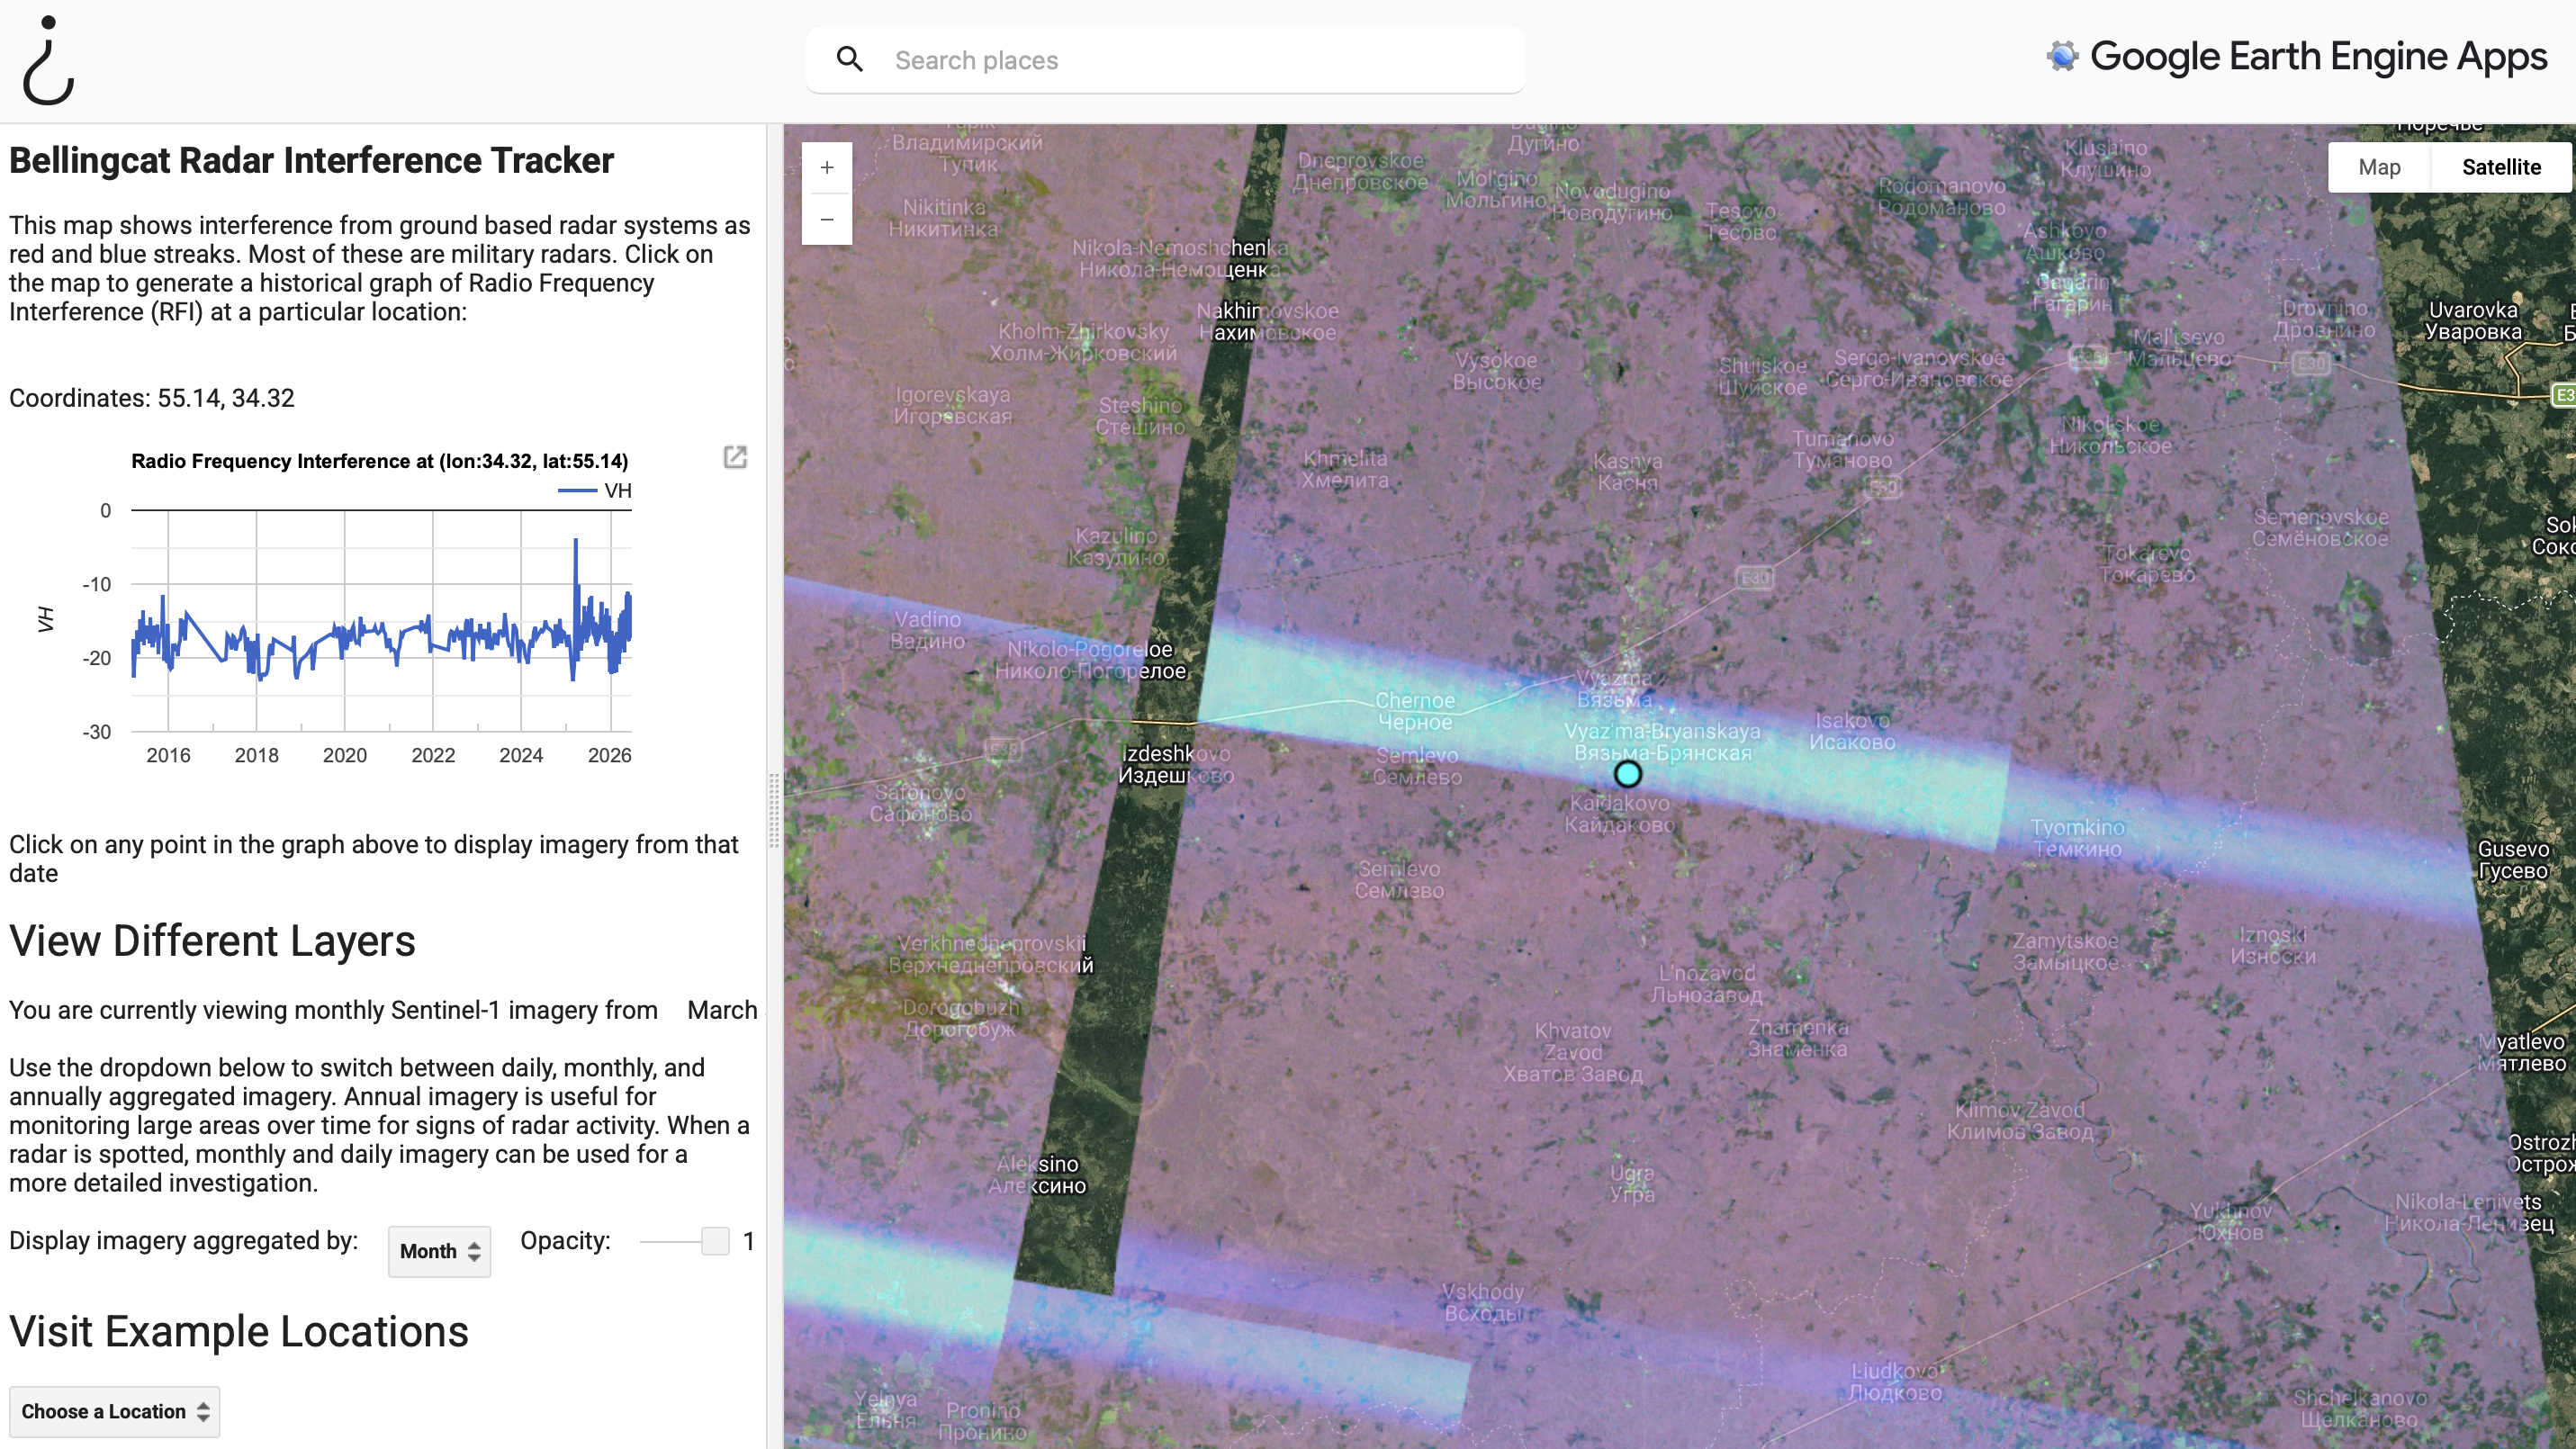
Each of the two Sentinel-1 satellites captures the radar imagery from different angles, in some cases visualizing interferences as an X. Where two interference lines intersect, the location of interference source will be positioned within the area common to both lines. Note that the user will still need to search visually for the source to confirm its existence and exact location within that common area.

<figure><img src="/files/Ayg52QC3Ata9bGNZKxqz" alt=""><figcaption><p>Example of Sentinel 1 interference over multiple passes, creating an X on the potential interference location</p></figcaption></figure>

The interference areas on the SAR imagery show up only if the source of the inteference is turned on. It is possible to have only one stripe of interference, in which case, the land area to search visually is only reduced to the length and width of the interference stripe. Furthermore, since each location on the planet is passed over once every 6 days by one of the satellites, it is possible a radar interference will not be captured if a system is activated between each satellite visit.

<figure><img src="/files/FlzqrhTzcGWmtwKEtnQR" alt=""><figcaption><p>Example of where only one interference stripe appears, thus requiring a larger visual satellite search to find the source of the interference.</p></figcaption></figure>

### Examples

Locations where the tracker has suggested radar systems are present according to Ollie Ballinger's [original article](https://www.bellingcat.com/resources/2022/02/11/radar-interference-tracker-a-new-open-source-tool-to-locate-active-military-radar-systems/) include: Russia, Bahrain, Qatar, Jordan, Yemen, Dammam, Saudi Arabia, the [White Sands Missile Range](https://www.google.com/maps/@32.3785089,-106.4718007,6035m/data=!3m1!1e3) in New Mexico, USA, and the [Dimona Radar Facility](https://www.google.com/maps/place/Dimona+Radar+Facility/@30.9685089,35.0948799,782m/data=!3m2!1e3!4b1!4m5!3m4!1s0x150237648ec9b907:0xde8df259d70896ce!8m2!3d30.9685089!4d35.0970686) in Israel.

According to the [Ollie's article](https://www.bellingcat.com/resources/2022/02/11/radar-interference-tracker-a-new-open-source-tool-to-locate-active-military-radar-systems/) among other systems the tracker has been used to identify:

* US MIM-104 Patriot and PAC-2 missile defence systems
* Russia surface-to-air missile (SAM) systems in Syria and S-400 SNAR-10M1 radar systems.

{% hint style="warning" %}
Although the RIT tool can help hone in on areas of interest, a manual search of what is underneath the interference is required to identify candidates of the interference.
{% endhint %}

### How to use

#### **Features**

{% tabs %}
{% tab title="Navigation Overview" %}

1. Search bar
2. Radio Frequency Interference graph
3. Aggregation
4. Visit Example Location
5. Map Interface

<figure><img src="/files/73Yyu389oqj1bG5flSv3" alt=""><figcaption></figcaption></figure>
{% endtab %}

{% tab title="1. Search bar" %}
The search bar enables searches of the map by the name of an address or a general location, such as a city. Note that entering coordinates in the Search Bar doesn't seem to work well. Instead, try entering them manually in the website address.

<figure><img src="/files/EBbfPKK4lOUXJOwCWnm7" alt=""><figcaption></figcaption></figure>
{% endtab %}

{% tab title="2. Radio Frequency Interference" %}
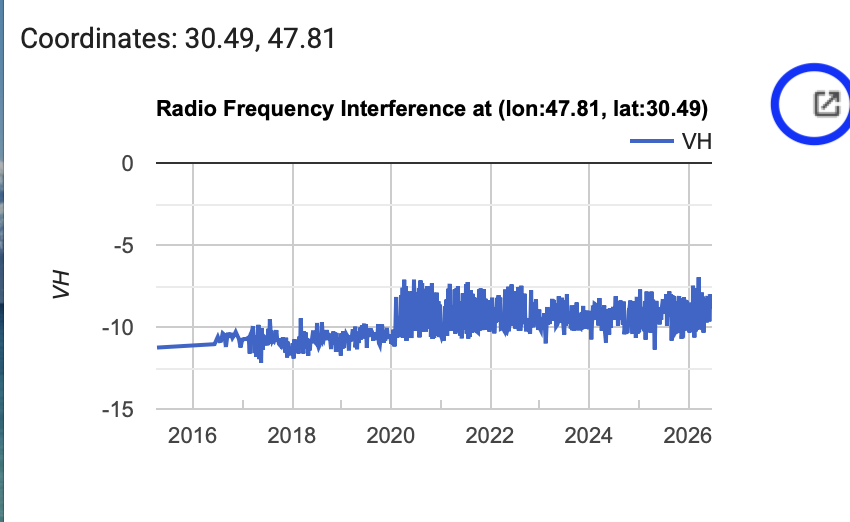
The graph visualizes the radio frequency from the satellites at a particular location.

**y-axis** = the strength of the reflected signal

**x-axis** = time

The spikes on the y-axis represent the interference. You can click on the points on the graph to get the map for that day, month or year. If you want to see the data for a day, you'll have to adjust the imagery aggregation to "Day" in section 3.

You can make the graph bigger by clicking on the expand button on the top right.

<figure><img src="/files/vrxXix8Xjkyq5Lg7TXgH" alt="" width="375"><figcaption></figcaption></figure>
{% endtab %}

{% tab title="3. Aggregation" %}
This dropdown menu allows the user to change how the SAR data is aggregated on the map. **The map defaults to monthly aggregation.**

Selecting "Day" will show the specific day that can be selected on the graph in section 2. Selecting "Month" or "Year" will visualize the aggregated SAR data for the month or year, respectfully. Note that the signal interefence has to be seen just once by the Sentinel 1 satellites within a time period in order to appear on aggreation levels by month or year.

Here, you can also change the opacity of the SAR data. 1 is the most opaque, while decreasing opacity below one will increase the transparency of the SAR data, for example if you'd like to look more closely at the visual map underneath.
{% endtab %}

{% tab title="4. Visit Example Locations" %}
If you'd like to see prior known examples of radar systems, as described by Ollie Ballinger's [article](https://www.bellingcat.com/resources/2022/02/11/radar-interference-tracker-a-new-open-source-tool-to-locate-active-military-radar-systems/), then you can find them here.

**Example Locations Include:**

* Dammam, Saudi Arabia
* Dimona Radar Facility, Israel
* Rostov-on-Don, Russia
* White Sands Missile Range, USA
* Kashmir, India/Pakistan Border
* Russian Occupied Crimea, Ukraine

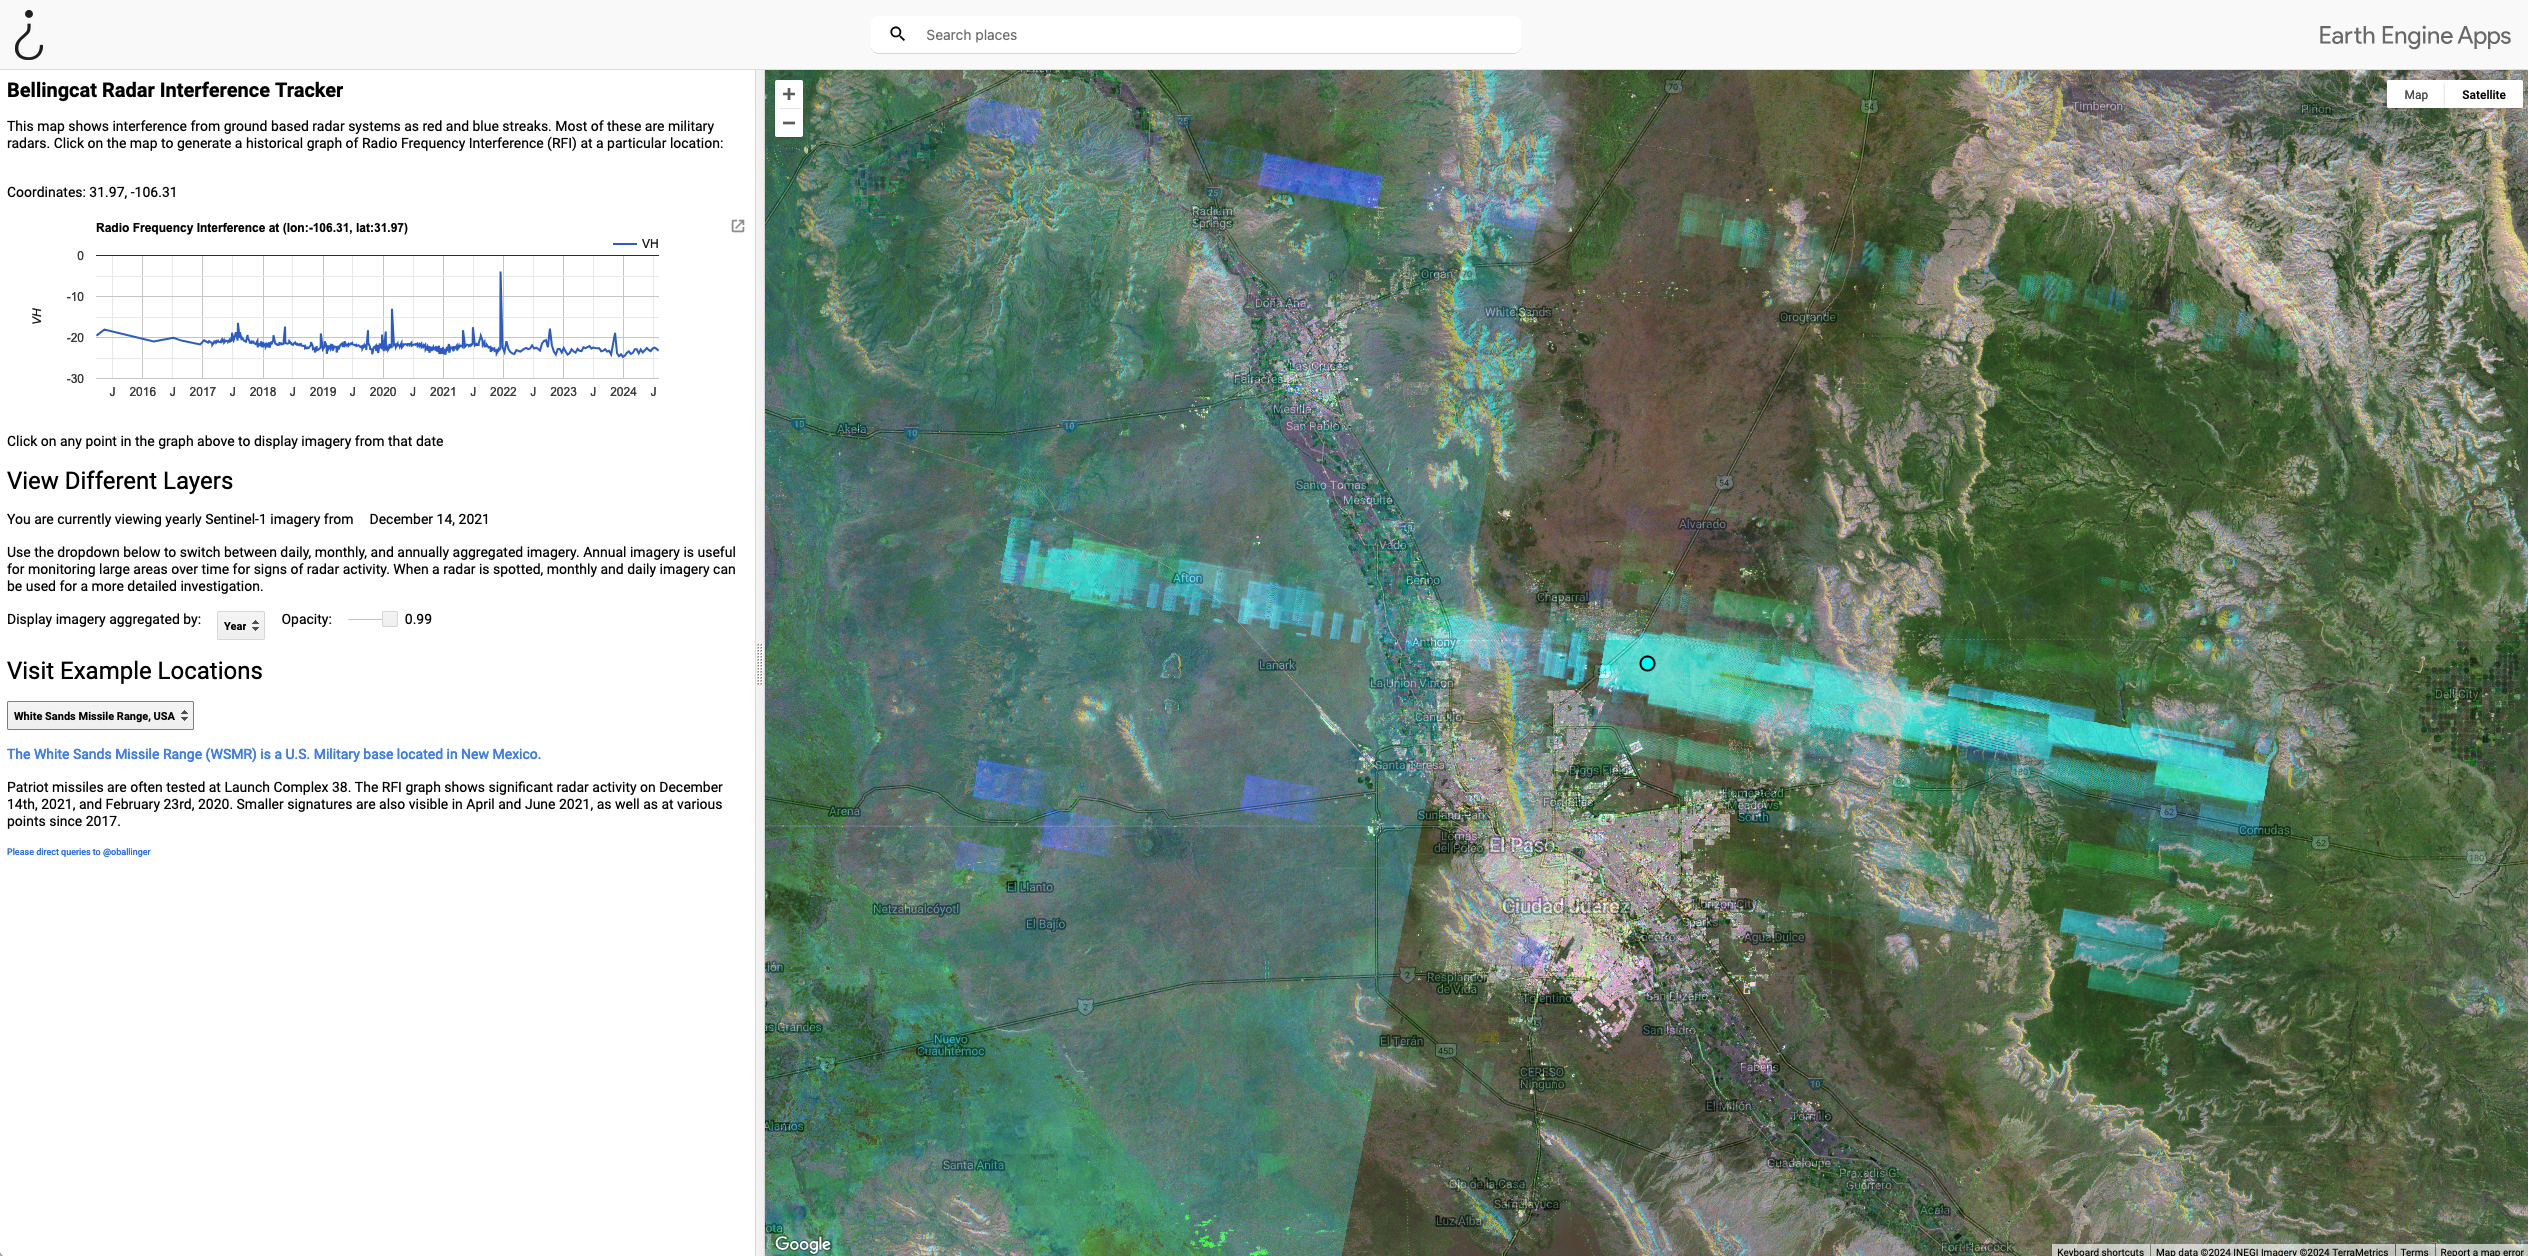
The screenshot below shows the White Sands Missile Range, USA example included with the radar interference tool.

<figure><img src="/files/nvJaMaH3Ks9WZs7n1hYV" alt="Screenshot using the White Sands Missile Range, USA radar interference example in the radar interference tracker. The map show a satellite image of the area overlayed with a coloured stripe indicating the radar interference."><figcaption><p>Screenshot of White Sands Missile Range, USA radar interference</p></figcaption></figure>
{% endtab %}

{% tab title="5. Map Interface " %}
The map can be used the same as Google Earth:

* **Zoom tool:** zoom in and out on the map.
* **Terrain**: toggle terrain visualisation on or off.
* **Labels:** toggle labels on satellite imagery off or on.
  {% endtab %}
  {% endtabs %}

#### **Potential use cases**

There are two main use cases for this tool: 1. where you know of a specific location that you wish to study, and 2. where you wish to investigate cases of known interference. Below we guide you through some potential workflows for each use case.

**Location known**

If you have a location in mind and want to investigate whether any military radar systems have been used in that location, follow the proposed steps below. An application of this use case can be seen in the analysis of the [2019 Abqaiq Attack](https://youtu.be/qZ96MaXJmGY?t=1296).

*Summary of Proposed Steps:*

1. Load the RIT tool and enter the coordinates and date in the browser address bar, or enter the name of the location in the search bar. The map will load to the desired location and time, and also show a corresponding radio frequency interference graph. *Note that even though you are entering one date, the map will aggregate the data on a monthly level by default.*
2. Use the radio frequency graph to find the specific date you're looking for and click on it once you find it, and furthermore change the Aggregation to "Day". You'll be able to see any interference for that day.
3. Once you've investigated a particular location at a particular time, you may want to explore further by searching the area around the location or by searching other dates.
   1. *Date search:* Using the radio frequency graph, you can see if there are any spikes on the graph, which indicate that there was some sort of interference. Click on the spikes to further see the interference on the map.
   2. *Area search:* aggregate the map to "Year" and on the map, zoom out to see a wider area. If you see any interference in the area, you can use the next workflow.
4. Once you've found interference, use other sources to investigate the source of the interference.

**Interference known**

If you identified interference, either X patterns or single stripes in an area of interest and want to investigate further, you may follow these proposed steps, which are also discussed in Ollie Ballinger's [article](https://www.bellingcat.com/resources/2022/02/11/radar-interference-tracker-a-new-open-source-tool-to-locate-active-military-radar-systems/).

*Summary of Steps:*

1. Load the RIT tool and zoom in on the area with interference you wish to investigate.
2. Change the aggregation to "Year" to better see all sources of interference within that time frame. *Note that the default will be the most recent year, however you can see earlier years by clicking on a date in the desired year on the radio interference graph.*
3. On the map, click on the spot you wish to investigate further. If the interference creates an X, then click on the intersection of the two stripes of interference. If it's a single stripe, click anywhere within the stripe. A blue dot will appear to mark your location. The radio interference frequency graph will load for that particular point.
4. Use the radio frequency graph to further investigate interference at that location - each spike represents interference. You can click on any point on the radio interference graph to obtain the visual representation of the interference on the map. Change the aggregation to "Day" to see only the interference for that day.
5. Once you've found a day with interference, conduct a visual investigation of the area underneath the interference. You can start the search within the RIT tool by lowering the Opacity and visually searching for anything that may explain the interference, such as formation of [military equipment](https://x.com/LostWeapons/status/957342822377472000?ref_src=twsrc%5Etfw%7Ctwcamp%5Etweetembed%7Ctwterm%5E957342822377472000%7Ctwgr%5Ed5bea1fa36381ff3dd0e8a27342c8d88b1ee902a%7Ctwcon%5Es1_c10\&ref_url=https%3A%2F%2Fcdn.embedly.com%2Fwidgets%2Fmedia.html%3Ftype%3Dtext2Fhtmlkey%3Da19fcc184b9711e1b4764040d3dc5c07schema%3Dtwitterurl%3Dhttps3A%2F%2Ftwitter.com%2Flostweapons%2Fstatus%2F957342822377472000image%3Dhttps3A%2F%2Fi.embed.ly%2F1%2Fimage3Furl3Dhttps253A252F252Fpbs.twimg.com252Fmedia252FDUkp-6mV4AA6Rrp.jpg253Alarge26key3Da19fcc184b9711e1b4764040d3dc5c07) or other [telecommunication](https://www.bellingcat.com/app/uploads/2022/02/image2.png) equipment.

{% hint style="warning" %}
It is a good idea to cross reference with other satellite maps and tools for more up-to-date imagery and information. Keep in mind that what may appear to be the source is not always the actual source within this tool.
{% endhint %}

## Cost

* [x] Free
* [ ] Partially Free
* [ ] Paid

## Level of difficulty

<table><thead><tr><th data-type="rating" data-max="5"></th></tr></thead><tbody><tr><td>3</td></tr></tbody></table>

## Requirements

* **Web:** any modern web browser.
* **Internet:** a reliable network connection.

## Limitations

* **Other sources of interference:** Not every instance of SAR radio frequency interference is caused by a military radar. [Weather radar, telecommunications infrastructure](https://doi.org/10.3390/s20102919), other [satellites](https://calvalportal.ceos.org/html/portal/sarc/documents/documents/ghajduch-20191119_1110.pdf), and other sources use the same frequency, which are picked up by Sentinel-1.
* **Processing time**: aggregating by year can be slow according to the [original article](https://www.bellingcat.com/resources/2022/02/11/radar-interference-tracker-a-new-open-source-tool-to-locate-active-military-radar-systems/).
* **Incomplete loading:** sometimes not all of the SAR imagery loads for a location. Most likely the imagery exists, but needs to be accessed again via a refresh, by zooming in or out, by moving the map, or even by accessing from a different browser.
* **Data Currency:** High resolution satellite imagery is not necessarily current. Although imagery is generally fairly recent, it can be a few years old. See Ollie Ballinger's [original article](https://www.bellingcat.com/resources/2022/02/11/radar-interference-tracker-a-new-open-source-tool-to-locate-active-military-radar-systems/).
* **Temporal refresh rates:** Sentinel-1 has a [six-day revisit time](https://www.earthdata.nasa.gov/data/platforms/space-based-platforms/sentinel-1) as the satellites circle the globe. If a radar was turned on and off between the revisit time, then it will not be captured by the satellite.
* **Facility verification:** there could be multiple potential sources (weather, telecommunications, etc.) of interference in the search area of the interference stripe, and just because something looks like a military base, it doesn’t mean that it is, so it is important to always verify your findings with multiple sources.

## Ethical Considerations

* see General Ethical Considerations.

{% hint style="warning" %}
Consider if it is advisable to publish known locations of military radar systems.
{% endhint %}

## Guides and articles

To effectively use the Radar Interference Tracker, especially for beginners or those looking to refine their skills, the following resources are highly recommended:

**Official Wiki**

* <https://github.com/bellingcat/sar-interference-tracker>

**Tutorials and Articles**

* Ballinger, O. (2022) *Radar Interference Tracker: A New Open Source Tool to Locate Active Military Radar Systems*, *bellingcat*. Available at: <https://www.bellingcat.com/resources/2022/02/11/radar-interference-tracker-a-new-open-source-tool-to-locate-active-military-radar-systems/> (Accessed: 21 June 2026).
* Chojka, A., Artiemjew, P., & Rapiński, J. (2020). 'RFI Artefacts Detection in Sentinel-1 Level-1 SLC Data Based On Image Processing Techniques', *Sensors*, 20(10):2919. Available at: <https://doi.org/10.3390/s20102919>
* Leng, X., Ji, K. and Kuang, G. (2021) ‘Radio Frequency Interference Detection and Localization in Sentinel-1 Images’, *IEEE Transactions on Geoscience and Remote Sensing*, 59(11), pp. 9270–9281. Available at: <https://doi.org/10.1109/TGRS.2021.3049472>.

**Video Tutorials**

* *Radar Interference Tracker within SAR data - Ollie Ballinger (UCL)* (2022). Available at: <https://www.youtube.com/watch?v=qZ96MaXJmGY> (Accessed: 21 June 2026).

**Community and Support**

* <https://github.com/bellingcat/sar-interference-tracker>

## Tool provider

[Bellingcat](https://www.bellingcat.com/), Netherlands

## Advertising Trackers

* [ ] This tool has not been checked for advertising trackers yet.
* [x] This tool uses tracking cookies. Use with caution.
* [ ] This tool does not appear to use tracking cookies.

| Page maintainer                                                        |
| ---------------------------------------------------------------------- |
| Bellingcat Volunteer Team. Updated by Alexandra Malikova in June 2026. |


---

# Agent Instructions
This documentation is published with GitBook. GitBook is the documentation platform designed so that both humans and AI agents can read, navigate, and reason over technical content effectively. Learn more at gitbook.com.

## Querying This Documentation
If you need additional information that is not directly available in this page, you can query the documentation dynamically by asking a question.

Perform an HTTP GET request on the current page URL with the `ask` query parameter, and the optional `goal` query parameter:

```
GET https://bellingcat.gitbook.io/toolkit/more/all-tools/radar-interference-tracker.md?ask=<question>&goal=<endgoal>
```

`ask` is the immediate question: it should be specific, self-contained, and written in natural language.
`goal` is optional and describes the broader end goal you are ultimately trying to accomplish on behalf of the user. GitBook uses it to tailor the answer towards what is most useful for that goal.

The response will contain a direct answer to the question and relevant excerpts and sources from the documentation.

Use this mechanism when the answer is not explicitly present in the current page, you need clarification or additional context, or you want to retrieve related documentation sections.