> For the complete documentation index, see [llms.txt](https://bellingcat.gitbook.io/toolkit/llms.txt). Markdown versions of documentation pages are available by appending `.md` to page URLs; this page is available as [Markdown](https://bellingcat.gitbook.io/toolkit/more/all-tools/index-database.md).
# Index Database
A database which relates remote sensing indices with satellite imaging sensors
## URL
## Description
A searchable web database of remote sensing indices (sensing indices are metrics which indicate research parameters such as vegetation health, land use, water stress) that allows users to search for relevant satellite sensors for a given application. The search may also be performed in reverse, listing as output the indices which it is possible to calculate from a given input remote sensing dataset. The database also links different indices to their respective applications, providing references to academic literature demonstrating their usage.
{% hint style="warning" %}
The Index DataBase search functionality can be difficult to grasp initially due to the design of the page. When you enter the site's home page, you are presented with eight different ways to "Query the Database." Each is a hyperlink, formatted as "Show \[information you want] for selected \[information you have]." To perform a search, identify what category of information you have (i.e. Indices, Sensor, Application) and what information you want.
{% endhint %}
## Cost
* [x] Free
* [ ] Partially Free
* [ ] Paid
## Level of difficulty
3
The Index DataBase interface can be somewhat confusing for new users, however, once accustomed to the design choices, it is easily navigable. This difficulty rating also reflects the contextual understanding necessary to apply the indices to produce useful imagery that accomplishes what the user intends.
## Requirements
* A web browser to access the database
* No login is required
* Remote sensing data
* The Index DataBase provides users with band indices, mathematical equations that convert satellite-based multi-spectral camera data into images. In order to use an index to produce an image, you will need the raw satellite imagery.
* You may also need GIS software, such as [QGIS](https://bellingcat.gitbook.io/toolkit/more/all-tools/qgis#url) to render the image, depending on how your investigation is being conducted. For most entry-level investigations, Copernicus Browser can fulfill most of your needs without downloading any application or logging in to any website, however it may limit you to specific sensors or indices.
## Limitations
The index lists sensors, and not the datasets linked to each sensor -- so if you're interested in using the data there is a secondary step of searching for the dataset, which may or may not be freely available and/or accessible. Indices are listed with relevant applications and references to academic literature, however it may take some reading to work out what is right for your application.
The index does not appear to be under active development, and the researchers whose contact details are listed did not respond to a query as to whether the tool was still active. As the data listed relate to physical properties of materials, they aren't liable to go 'out of date', but it's possible that some indices might be superseded by more recent research, the satellites referred to will go out of date, and that the index will become less exhaustive over time.
## Ethical Considerations
Like any tool related to or making use of remote sensing data, the ethical considerations of IDB relate primarily to accuracy, and the broader systemic effects of developing systems for monitoring/understanding an environment or a social system that are based remotely and don't have a lot to do with the people and ecology there. It's always worth thinking about the basis for claims that are made using these tools.
## Guide
Examples of use cases for various band indices:
Below is an example of a basic IDB search, using a case study from "Yemen’s Disappearing Date Palms: Applied Environmental OSINT":
{% tabs %}
{% tab title="Identify an AoI" %}
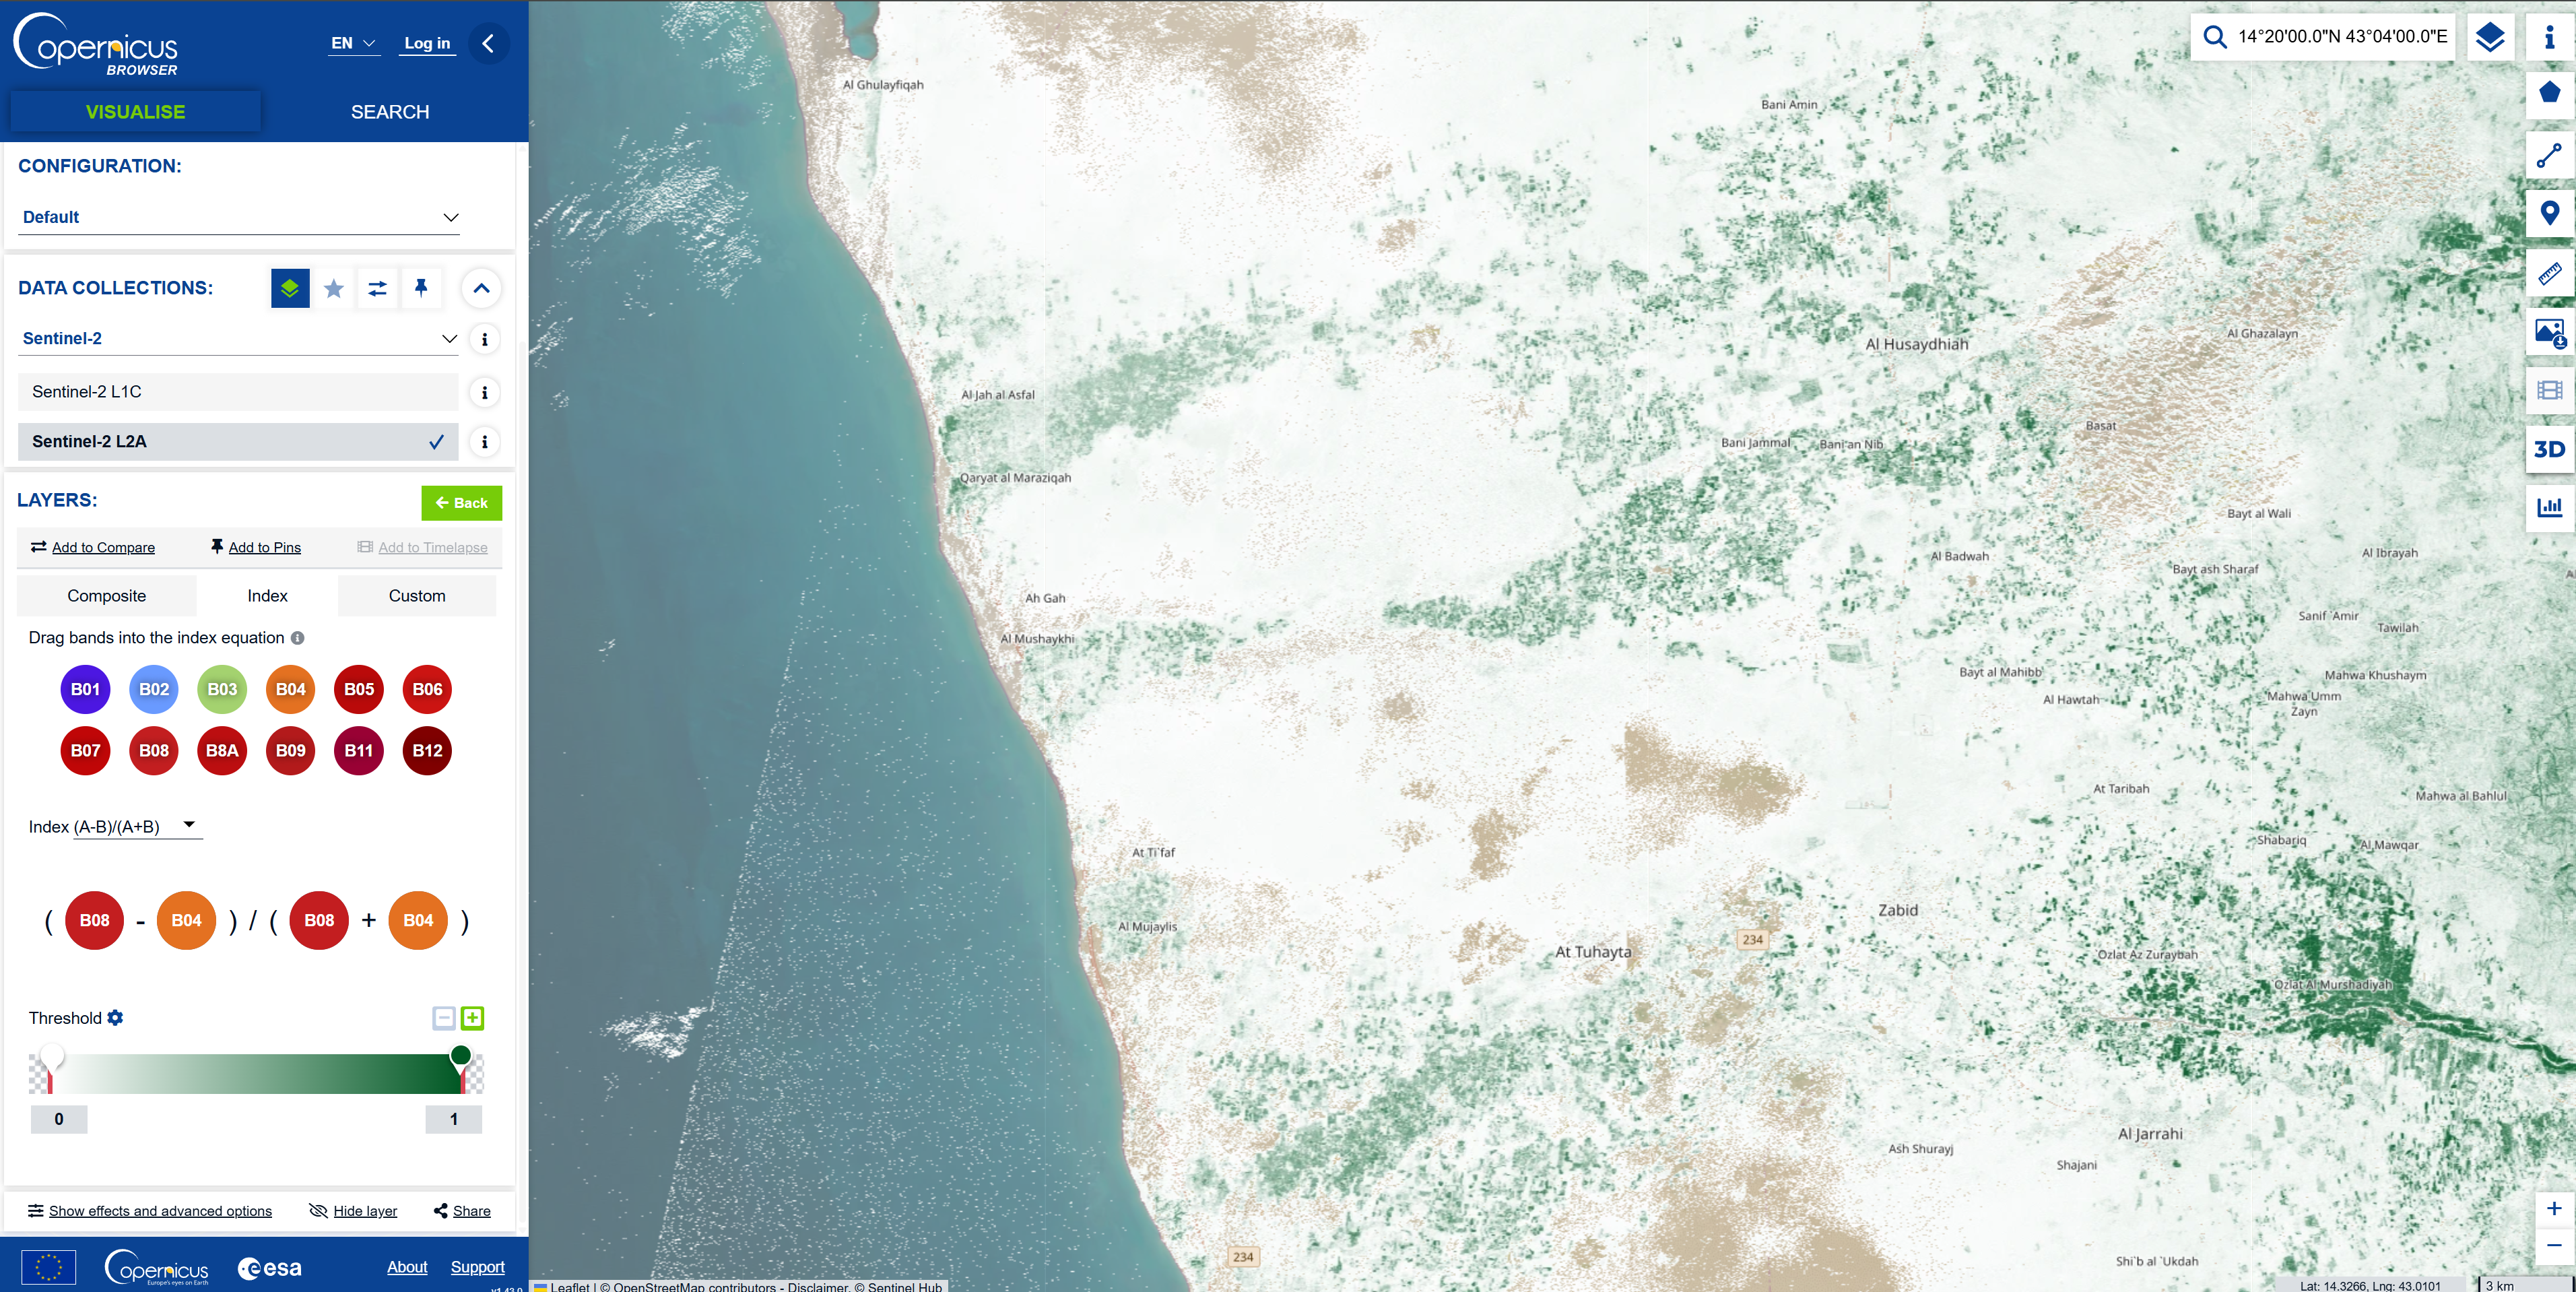
To begin, choose an area of interest. Above is a screenshot from [Copernicus Browser](https://bellingcat.gitbook.io/toolkit/more/all-tools/sentinal-hub-playground), an entry-level, but extremely capable, web-based tool for viewing remote sensing data. It shows the geographical area southwest of Bayt Al Faqiah in Western Yemen that Wim Zwijnenburg examined in 2020 in an analysis of date palm biomass health in Yemen for Bellingcat.
{% endtab %}
{% tab title="Query" %}
Open Index DataBase. In this case, we know that the Copernicus data is from Sentinel 2 and we know that we’re looking at date palm biomass health, so we’ll search by selected Sensor and Application.
{% endtab %}
{% tab title="Search!" %}
We know that our sensor is Sentinel 2 and that we're looking for biomass, so we enter those options from the dropdown menu and click Display Indices.
{% endtab %}
{% tab title="Select an Index" %}
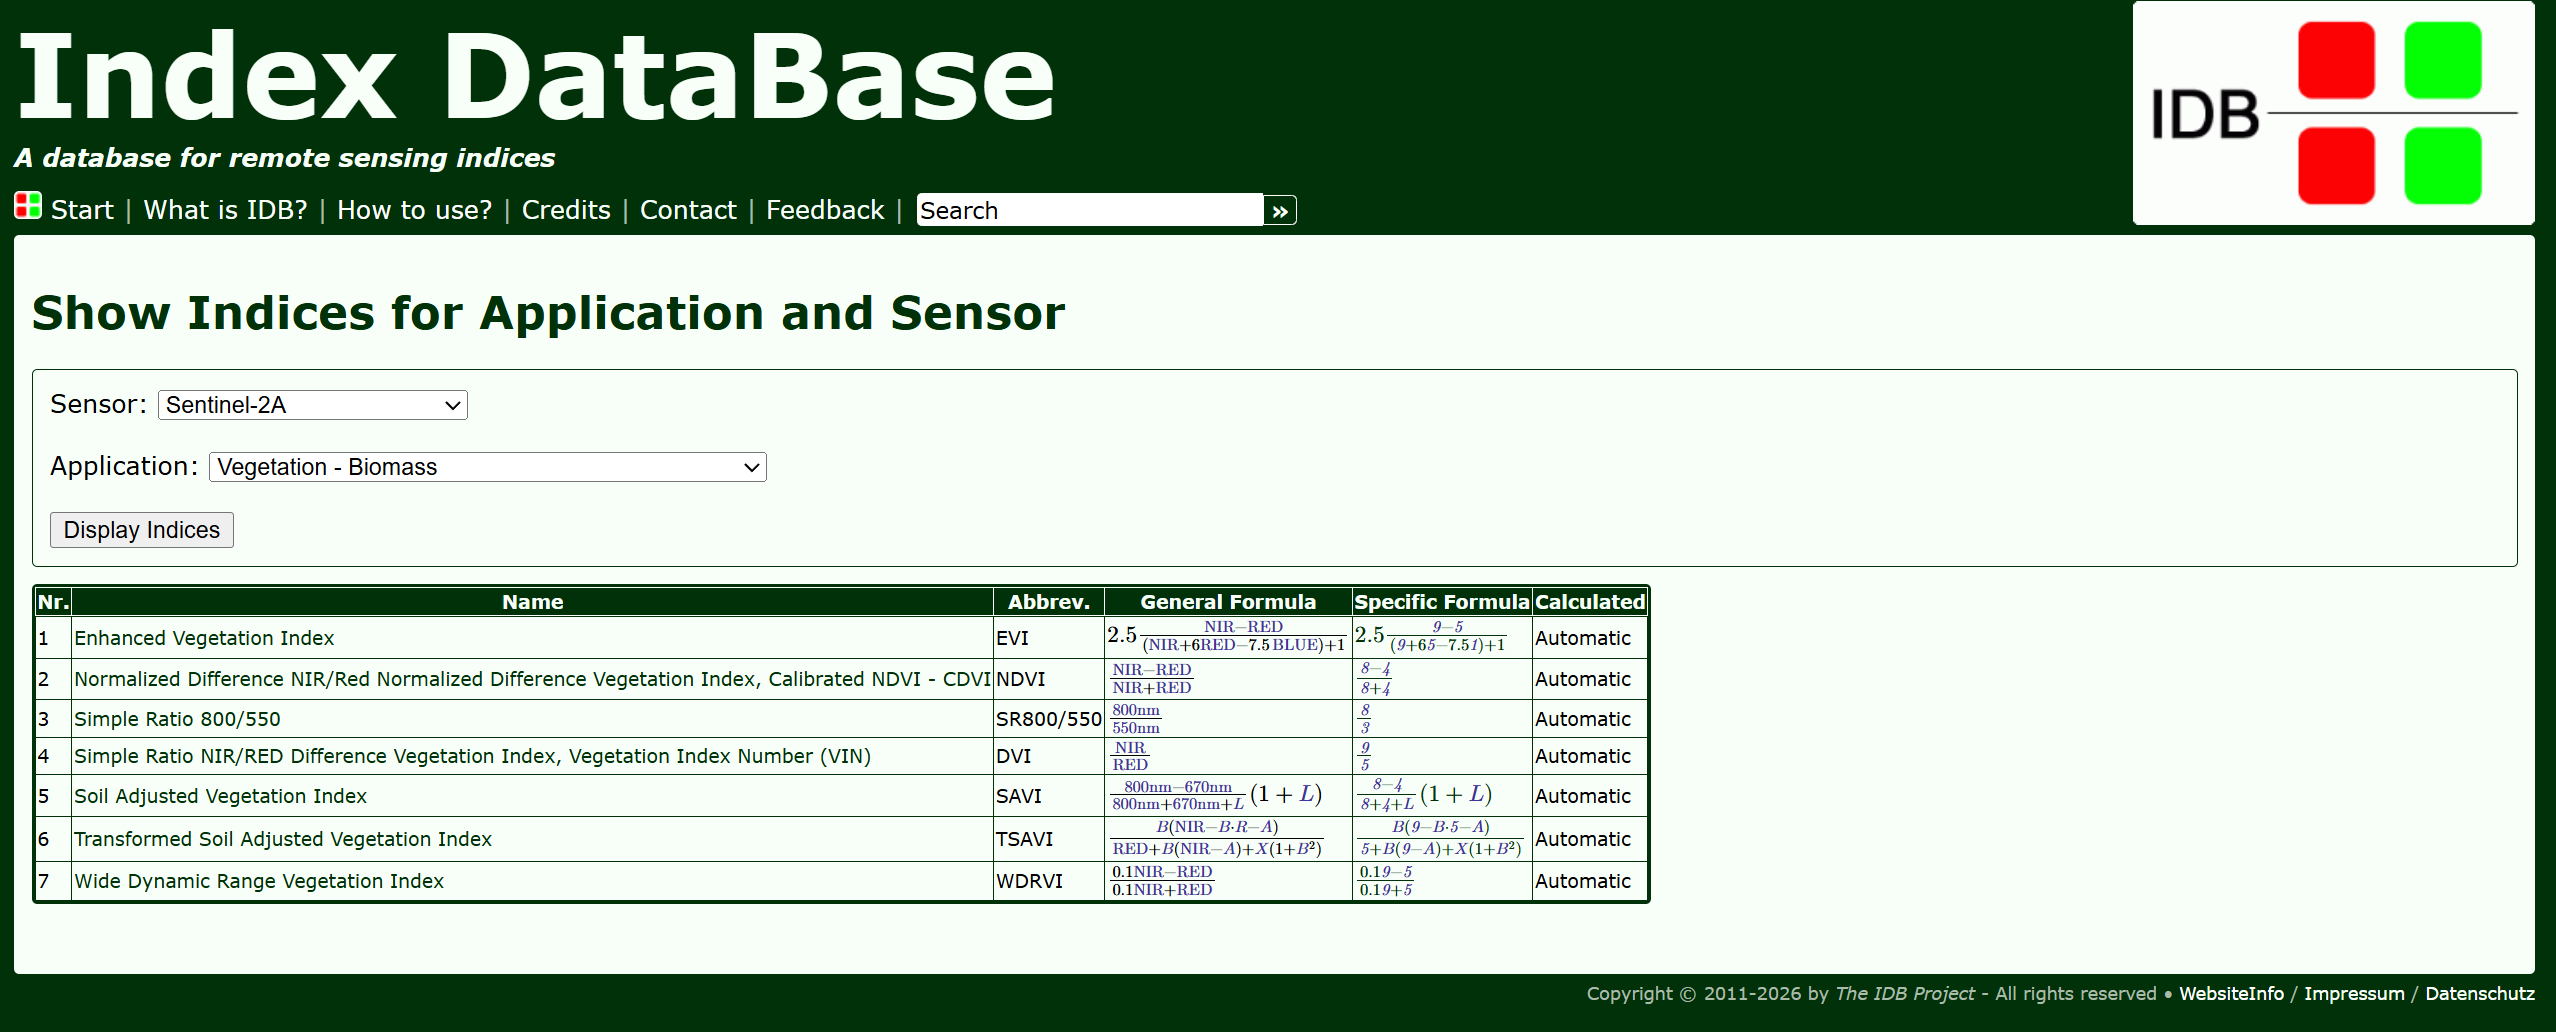
This search returns these seven options. Each is a remote sensing index that provides information about the biomass that the sensor can see. You can click on any of the available options to bring up the index's dedicated page containing, among other basic information, a non-exhaustive list of academic sources that use or discuss the listed index.
{% endtab %}
{% tab title="Find the Formula" %}
For our purposes, the basic Normalized Difference Vegetation Index or NDVI will be great. As you can see next to its generalized formula, the Index DataBase provides us with the specific formula to use the NDVI with Sentinel 2: (Band 8 - Band 4) / (Band 8 + Band 4).
{% endtab %}
{% tab title="Input the Formula" %}
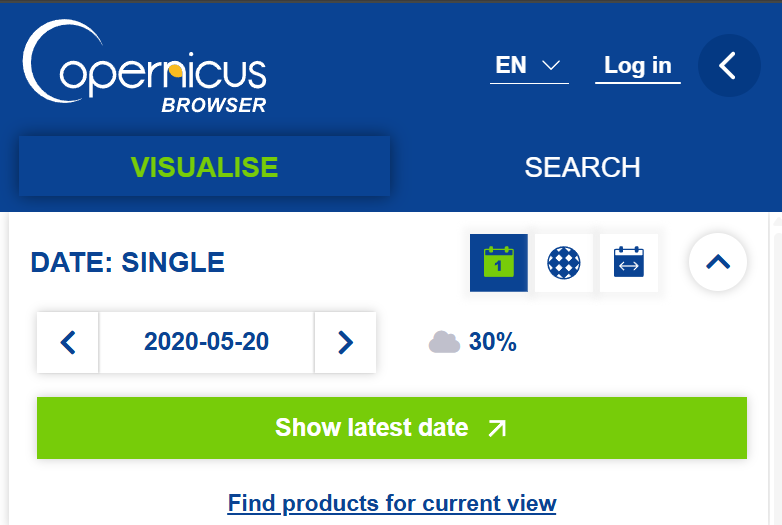
In the top left, select the date range you're interested in. I've chosen May 20th, 2020, as one of the dates that Wim selected for analysis.
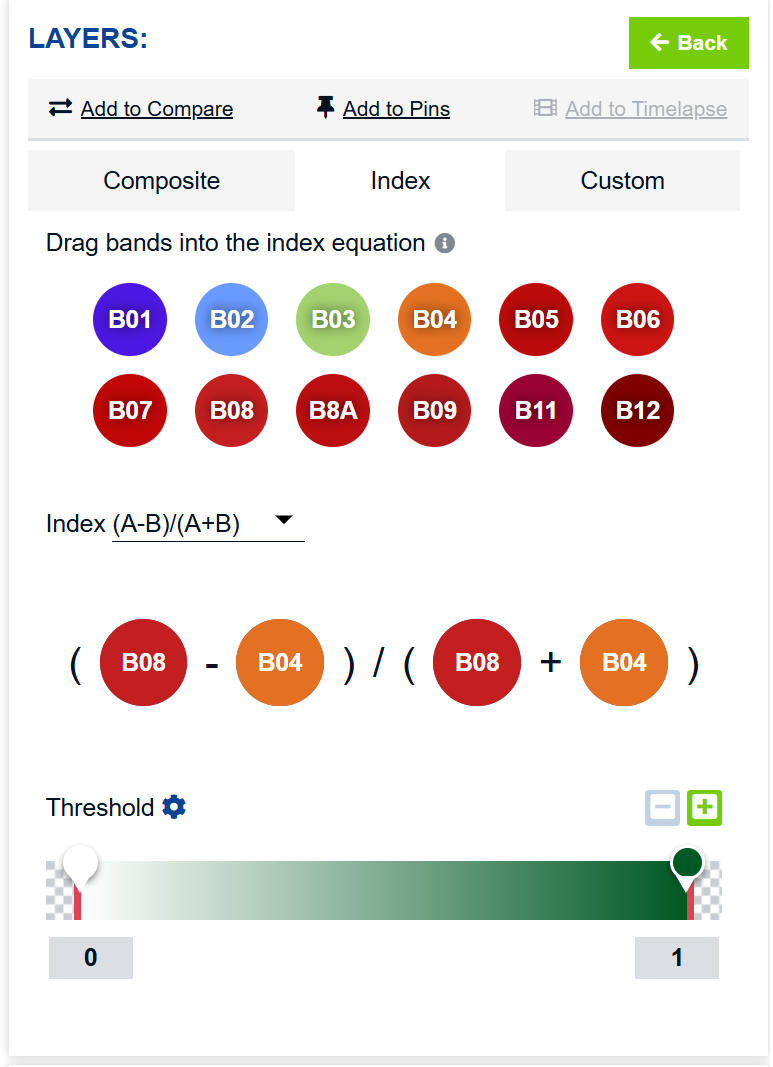
In the bottom left of the Layers section, click on the Index tab. Select an index of the matching form of the NDVI. Because the formula for our sensor is (Band 8 - Band 4) / (Band 8 + Band 4), we'll select the form (A-B)/(A+B). Then, we'll drag B08 (or Band 8) into the A variable and B04 (or Band 4) into the B variable. For more complicated variables, you may not be able to implement them through the basic index box. You may be able to find custom scripts for different indices on Sentinel Hub or you can write your own in Javascript, both of which would be input into the Custom tab rather than the Index tab.
For visibility, I selected the Threshold that creates a white to green gradient, with white representing very little to no healthy plant life, while the darker green represents dense concentrations of healthy plants.
{% endtab %}
{% tab title="Explore!" %}
And voila! Copernicus will show you what the image looks like. You can adjust your threshold settings, move around the map, zoom in for more detail, download images, and more to find the perfect way to illustrate your analysis. By comparing the differences at different dates, you can visualize changes to date palm health over time, as Wim did in the article linked above! By expanding on these fundamentals, the remote sensing world is yours to explore.
{% endtab %}
{% endtabs %}
{% hint style="warning" %}
The world of remote sensing indices is growing every day. The Index DataBase is not an exhaustive list and may not feature certain new and cutting-edge indices. The types of investigations that can be conducted using remote sensing data combined with these indices is too long to list. If you can't find an index in the database that fits your needs, you may need to do your own research to find more specific indices. Looking at the database's list of applications can give you a good sense of the types of information that can be discerned through remote sensing.
{% endhint %}
## Tool provider
Verena Henricht and Katharina Brüser, Institute of Crop Science and Resource Conservation (INRES)
## Advertising Trackers
* [ ] This tool has not been checked for advertising trackers yet.
* [x] This tool uses tracking cookies. Use with caution.
* [ ] This tool does not appear to use tracking cookies.
| Page maintainer |
| ---------------------------------------------------------------- |
| Bellingcat Volunteer Team. Updated by Nathan Burke in June 2026. |
| |
---
# Agent Instructions
This documentation is published with GitBook. GitBook is the documentation platform designed so that both humans and AI agents can read, navigate, and reason over technical content effectively. Learn more at gitbook.com.
## Querying This Documentation
If you need additional information that is not directly available in this page, you can query the documentation dynamically by asking a question.
Perform an HTTP GET request on the current page URL with the `ask` query parameter, and the optional `goal` query parameter:
```
GET https://bellingcat.gitbook.io/toolkit/more/all-tools/index-database.md?ask=&goal=
```
`ask` is the immediate question: it should be specific, self-contained, and written in natural language.
`goal` is optional and describes the broader end goal you are ultimately trying to accomplish on behalf of the user. GitBook uses it to tailor the answer towards what is most useful for that goal.
The response will contain a direct answer to the question and relevant excerpts and sources from the documentation.
Use this mechanism when the answer is not explicitly present in the current page, you need clarification or additional context, or you want to retrieve related documentation sections.
.png?alt=media)
.png?alt=media)
.png?alt=media)